
Most embodied carbon numbers live somewhere a structural engineer has to go looking for them — a spreadsheet, a one-off report, a slide buried halfway through a design meeting. By the time anyone outside the sustainability team sees the figure, the decision that produced it is already made. To make embodied carbon performance more visible during design, the project team integrated carbon tracking directly into the structural drawing set. .
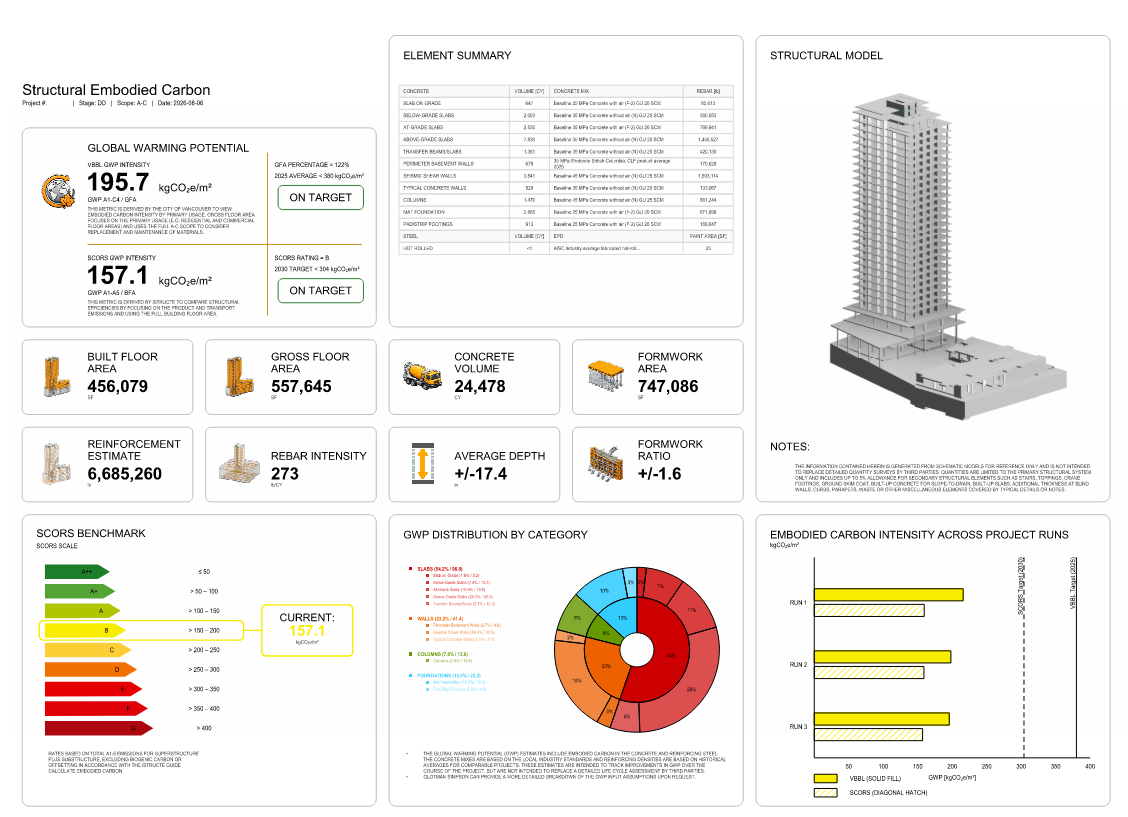
On a concrete high-rise currently in design in Metro Vancouver, embodied carbon performance appears alongside the framing plans and sections in the structural drawing set. The project team can now see how design decisions affect the building’s structural carbon footprint without searching through a separate spreadsheet, report, or presentation. It draws on the same quantities, mixes, and reinforcing densities already defined for construction documentation — nothing gets entered twice — and converts them using product-specific and industry-average emission factors for each material.
We run the LCA (Life-Cycle Assessment) at key points in the design, then update the sheet. At any snapshot in time, we can trigger the automation and refresh the dashboard with current numbers, with no separate report and no manual re-entry. We encourage other firms follow a similar process where possible — the more teams that can see this data in real time, the faster the industry can act on it.
MEASURING PERFORMANCE AGAINST TWO BENCHMARKS
At the current stage of design development, that sheet reports two numbers side by side — one local, one international.
The VBBL metric is the City of Vancouver’s own measure; on this project it comes to 195.7 kgCO₂e/m², comfortably under the city’s proposed reduced target of 380, leaving plenty of room for the building envelope scope that is required for regulatory reporting in Vancouver. It’s the number that matters most to local developers and owners, since it’s tied directly to Vancouver’s own bylaw and benchmarks.
Using the Institution of Structural Engineers’ Structural Carbon Rating Scheme methodology, commonly known as SCORS, the same project measures 157.1 kgCO₂e/m² or grade B. This is below Glotman Simpson’s 2030 stretch target of 304. Because SCORS assess structural carbon relative to building floor area, it provides a useful basis for comparing the project with work beyond Vancouver.
Those results show meaningful progress against both local and international benchmarks. And yet, on SCORS’ own A++ to G letter scale, 157.1 still only earns a B. Both things are true at the same time, and the gap between them is the point: the bar we’re holding ourselves to is already more ambitious than code requires, and there’s still real distance between beating our own 2030 target and sitting at the top of the scale. Putting both numbers on the drawing, in public, is what keeps that distance visible instead of comfortable.
A RUNNING RECORD OF DESIGN DECISIONS
The dashboard isn’t a one-time snapshot. We record each design milestone, so the same sheet that shows 157.1 kgCO₂e/m² today will show whatever the number becomes after the next round of decisions. Instead of a single verdict handed down at the end, it’s a running scoreboard — each iteration either moves the design closer to target or it doesn’t, and now that’s something the whole team can see, not just the engineer who ran the numbers.
Making carbon performance visible throughout design helps teams identify opportunities earlier, when changes are less costly and have greater impact. It also creates a shared reference point for discussions among owners, architects, contractors, and suppliers.
TURNING VISIBILITY INTO ACTION
That visibility is what moves the needle, because it changes the conversations a project can have. Because the dashboard sits on the same sheet set the architect, contractor, and owner already review, embodied carbon becomes part of the broader design conversation rather than a separate sustainability exercise completed after key decisions have been made.
The mix assumptions behind each number are spelled out right there too — which concrete mix, what SCM content, by element — so when a contractor or supplier wants to propose a substitution, there’s already a clear, specific starting point for that conversation instead of a generic ask to “reduce carbon.”
A distribution chart helps focus the team’s attention. By showing which structural elements account for the largest share of emissions, it identifies where further design work, or material changes could have the greatest effect.
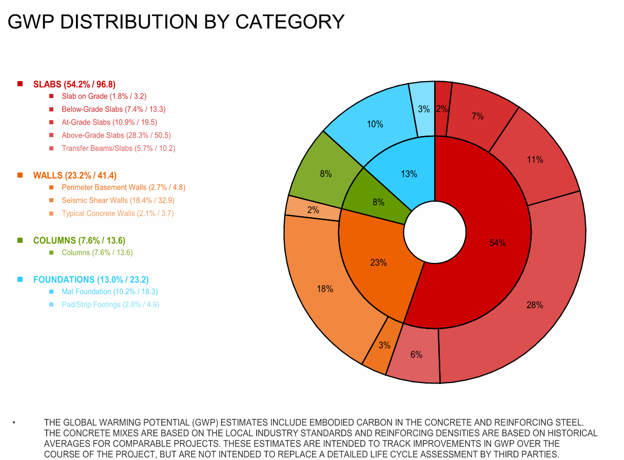
On this project, that breakdown looks like roughly 54% of structural embodied carbon in the slabs, 23% in the walls, 13% in the foundations, and 8% in the columns.
In a concrete high-rise, the carbon is overwhelmingly in the floors stacked on top of each other but often provides the least flexibility – floor-floor heights are squeezed, and construction cycles reduce opportunity for low carbon concrete. Transfer beams and slabs can often account for over 10% of a tower’s total structural emissions, but careful design kept that figure under 6% on this project — a result of deliberate choices, not luck.
The same breakdown is pointing us toward the next one: for large-volume elements like the mat foundation and the seismic shear walls, where the construction schedule doesn’t depend on how fast the concrete gains strength, we’re looking at delay mixes — lower-carbon concrete designed for a longer curing time — specifically because those pours are large enough for it to matter.
If you’re interested in learning more, would like to set up a lunch and learn, or have a project where this could be put to use, reach out to [email protected].
Written by: Rory Roberts, P Eng – Director of Sustainability
Together, we can contribute to a more sustainable built environment. If you are interested in sustainability and would like to discuss any of the topics in this article, please get in touch with us at [email protected].
For more information on our sustainability initiatives and to stay updated on our latest projects, visit our website and follow our OnTrack blog series.